Posts Tagged ‘investment’

Retiree Stumbling Blocks

May 30, 2011

Five Retiree Stumbling Blocks

by John Wasik  May 27, 2011  posted on Morningstar.com

Comment regarding this post by John Wasik

“Republicans in the U.S. House have proposed privatizing Medicare for those under 55.”

Not true. First, “privatized Medicare” is an oxymoron. It’s either privatized or Medicare.  The Ryan plan provides a subsidized insurance voucher so that individuals can purchase the health insurance they need. I’m almost 65 and would prefer this approach to a one size fits all Medicare system that can’t tell the difference between
Prostate Cancer (for which I had surgery 6 months ago) and “The Scooter Store” mechanized chairs.

My private, individual insurance (BCBS) for myself and my wife is less than $12,000 a year (high deductible, HSA) and it provides excellent coverage. An assist on the premium/deductible (the Ryan plan) is all I would ask for in exchange for the Medicare taxes paid in over a lifetime. [Or, don’t tax me and I’ll pay for it all.]

Raising the retirement age is shorthand for letting more people die before they (a) collect any social security or (b) before they collect enough to recover what they paid in taxes. It ends up screwing the families of those
who end up in (a) or (b). Social Security is a massive, generational Ponzi scheme that depends on an ever growing mass of workers that either die young or young enough to ensure that benefits can be paid to those who win the longevity lottery. It is an insult to those who work with their hands and backs crafted by those who sit on their butts.

“My humble prediction is that taxes will be raised on retirees, out-of-pocket medical expenses will increase, or overall retirement benefits will be cut in some way.”

We have to do something to prevent national bankruptcy. As even Bill Clinton acknowledged, we can’t let health care devour the economy. Canada is facing that fact at this time and is struggling to figure out how – besides
letting people die – to pay for all the benefits promised. Doctors are leaving the Massachusetts single payer plan. It is a hopeless bureaucratic paper shuffle to promise a benefit that can’t be provided. It is high time we geezers take the lead in moderating our entitlements.

Didn’t save enough for retirement? Why is that a problem for my children, my grandchildren, my great grandchildren not to mention my neighbors? If you would not ask your children/grandchildren/great grandchildren for $500, $1000, $1500 or more each month why would you have government take it from them
and their neighbors?

The use of TIPs as an inflation hedge pales beside high quality, dividend stocks as suggested by the S&P Dividend Aristocrats. Combine those with an investment grade bond fund or individual bonds and manage the allocation between 25/75 (bond/equity) to 75/25 (bond equity) depending on your economic outlook.

Mr. Wasik’s suggestion to be flexible is about the only useful point to this article. If you can’t determine a retirement budget (replacement rate / cost of living) how did you ever figure out a pre-retirement budget?

As for political changes? They are always coming. The best defense is to be a responsible individual and vote for the rare politician who supports responsible policies. You don’t have to agree with the Ryan plan (I don’t agree
with all of it) but it is a well developed, responsible plan that deserves honest debate. Not MediScare tactics to scare my 92 year old mother. That’s total BS. It is time to face up to the fact that our government spends too
much, we have too much debt and we must cut back in order to enable our children and grandchildren to have a chance to grow the economy. That would be the best thing we can do in our retirement.

Social Security: Welfare or Earned?

March 28, 2011

In 2010 President Obama’s Deficit Commission (ODC) announced some findings regarding, among other areas, Social Security. The result of all this political brain power are proposals to raise the full retirement age (again), raise the income subject to taxation (again), raise the minimum benefit amount (again), add (more) means testing, lower the cost of living adjustment (by changing how it is calculated) and enact a variety of bureaucratic administrative changes. Their combined efforts amount to little more than rough tweaking and kicking the SSA can down the road another 50 years. So they say. Given the obvious failure of the 1983 Greenspan Social Security Commission whose “solutions” didn’t even last 30 years it is highly unlikely that the ODC proposals will make it that far if they even see the legal light of day.

Missing from the political discussions of Social Security (SSA) is any description of the of actual program versus the rhetoric used to describe the program. Rhetoric from opponents of SSA claim individuals could obtain higher retirement benefits if they invested their own social security taxes and that SSA bankrupts the young to support the old. Rhetoric from supporters of SSA claim it is good social policy with descriptions ranging from insurance against senior poverty to wholly earned benefits. Neither side provides even a basic understanding of the actual SSA program. Instead they are content with tossing rhetorical fire bombs left and right.

To examine today’s SSA program in operation it is useful to determine how initial benefits payments related to the SSA taxes paid in to the system over a theoretical working career. If taxes paid amounted to less than benefits received then the recipient would be receiving some portion of welfare in their SSA benefits. If taxes paid were more than the benefits received then those individuals would, in effect, be subsidizing the benefits of the welfare group. One could certainly consider that subsidy as an ongoing “tax” paid by those, usually higher income, workers.

Chart #1 depicts the initial maximum SSA benefit provided in the year of retirement versus the level of benefit provided by the assumed SSA Earned Annuity. The earned annuity is a fixed payment lasting for 22 years and is dependent on the amount of SSA taxes paid. The higher the tax paid the higher the initial annuity. Thus the annuity beginning in 2007 is much higher than the annuity in 1987. And so were the SSA taxes. The initial SSA benefit assumes the maximum benefit payout in the year of retirement. While there was a flattening of this curve from 2002-2004 it otherwise is rising each year.

The key point in this chart is the difference between the two curves. From 1987 through about 1998 the maximum SSA benefit was far above the assumed earned annuity. The difference represents a welfare payment to the benefit recipient. In later years, starting about 2000 the earned annuity rose above the initial maximum SSA benefit. The difference this time represents earned income that is taxed away.

SSA Benefits vs Earned Annuity

Initial Maximum Benefit at Year of Retirement

Using data from the SSA website I created a spreadsheet that links maximum tax payments with maximum SSA benefits over the period 1937 through 2010. For its own reasons the SSA website assumes a 40 year working career. Thus someone retiring at the end of 1976 who worked the full 40 years and who paid in the maximum amount of taxation each year would have paid a total of $6,962 in SSA taxes. Their employer would have paid the same amount. Upon retirement at the end of 1976 this worker would be eligible to receive an SSA benefit of $3,427 per year. In just under two years this worker would have received back every dime they paid in SSA taxes. And this assumes the worker retires with reduced benefits at age 62.

That same worker retiring at 65 would receive $4,368 per year if a man and $4,546 per year if a woman. [There is a period from 1962 through 1977 when women aged 65 received a larger maximum SSA payment than men. It was 1962 through 1974 for women aged 62.] A woman retiring at 65 in 1976 would receive her entire SSA contributions back in just under 1 ½ years. A man would receive his back in just over 1 ½ years. But each would continue to receive those payments, along with inflation adjustments for the rest of their lives. Was that benefit earned or is it welfare?

Reasonable arguments regarding the earned versus welfare aspect of SSA benefits can be made on three grounds: (1) employer contributions are not included; (2) prospective earnings on the SSA contributions are not included; and, as always, (3) the situation is different now. Fair enough.

Employer Contributions: as a small business owner and employer, if I was not required to pay SSA taxes based on employee wages that money would not accrue to my employees. This is after all a tax on my status as an employer. If I had partners or utilized sub-contractors no SSA tax would be charged. Certainly some of that tax might find its way to the employees for competitive reasons but it is highly unlikely that all of it would accrue to them. More importantly that tax is no more the employee’s money than the income tax, property tax, unemployment tax or worker’s compensation tax. However, there is a substantial argument regarding the employer portion of SSA taxes. That money provides a revenue stream to the government be used for the other benefits (disability, spouse, etc.) currently provided by SSA.

Earnings on Contributions: this argument could turn either way depending on the investment return being assumed. It may or may not be sufficient to cover a retirees SSA benefits. There is a myth that individuals could have earned a far better return on their SSA tax than is implied by the benefits paid. Maybe, but not very likely. Consider that as long term retirement savings it is not reasonable to assume that individuals would be able to invest their SSA taxes in the stock market (or any other market). No rational person wants the government to do so and politics argues against letting individuals do so on their own behalf. If individual investors or markets temporarily failed it could result in a massive taxpayer cost for outright welfare support during retirement. (Politics would require a bailout whether I agree or not.) That would be a prime example of public risk versus private gain albeit on an individual basis. There is another alterative the Retirement Certificate of Deposit (RCD).

In order to estimate the earnings power of SSA taxes I assumed that individual employee SSA taxes earn the higher of 6% or the 10 year treasury bond rate and that all earnings be tax free. Accumulated contributions would be compounded annually and the rate would adjust annually depending on the then current 10 year treasury bond rate. Note that since 1968, 30 years had a 10 year treasury bond rate above 6%. This may seem rather conservative but then again, a conservative investment policy for retirement funds is wholly reasonable. As a example of how this might work we could assume all SSA taxes are held in a bank retirement certificate of deposit or RCD on behalf of each individual worker. Each year the bank accrues the current taxes and then pays the higher of 6% or the 10 year treasury bond interest rate on the total sum which is compounded annually. Note that a 6%, tax free, guaranteed rate of return provides good value compared to the 10% average historical stock market returns. Yes, government would be required to subsidize the interest rate as necessary to ensure the minimum 6% rate of return. Where might that money come from? From the employer portion of the SSA tax.

On this basis our worker who retired in 1976 after 40 years work, paying SSA tax at the maximum rate and receiving the aforementioned return on those taxes would accumulate a total of $14,439 of which $6,962 was actual taxes. At the maximum SSA benefit level of $3427 per year at age 62 the payback takes just under 4 ¼ years. At $5069 for women age 65 the payback takes just over 3 years 2 months. But the payments continue, with partial inflation adjustments for the rest of their lives. Since SSA uses a life expectancy of 22 years that means roughly 18-19 years of welfare payments for the 1976 retiree.

It’s Different Now: yes, actually it is different now but not all that much. It was earlier noted that the employer portion of SSA taxes is unlikely to accrue to the individual employee. Either because the employer would retain all or a portion of them or the government would utilize that revenue stream for other purposes. And, in all likelihood that’s exactly what would happen. So only the individual portion of SSA tax could be invested in a bank RCD on behalf of each individual while the employer portion of the tax would be retained by the government. It would be used for such purposes as: (a) subsidize the 6% retirement earnings as necessary; (b) provide for the disabled; (c) provide for non-working spouses or other individuals; and (d) pay existing retirees their benefits. Note that items (b), (c) and (d) are existing SSA programs. Good arguments can be made to shift all or some of those existing programs to general welfare as a more appropriate funding source but that’s another issue.

It is reasonable then to only look at the individual portion of SSA taxes versus benefits to determine how much welfare – if any – exists in the program today. An individual retiring at the end of 2009 (the first of the baby boomers) after working 40 years and who paid the maximum amount of SSA taxes would have paid in $115,800. If we assume the 6% RCD earnings scheme noted above the taxes plus earnings would amount to a combined total of $333,826. Continuing the 6% earnings scheme through retirement and assuming a life expectancy of 22 years that amount provides an annual annuity of $27,723. But only for 22 years. And no inflation adjustment either.

However, an individual with that work history who retires at age 62 at the end of 2009 would today be awarded an SSA benefit of only $21,228 per year. Thus today’s baby boomer retiree would be forgoing earned benefits of $6,495 per year (reduced by any future inflation adjustment). However, if that worker were married their spousal benefits would be $10,614 or $4,119 in net unearned – welfare – benefits. Of course that would be reduced by the work history and SSA taxes of the spouse.

Chart #2 is similar to Chart #1 except that it shows the SSA benefits as of the beginning of 2011 instead of the initial maximum at retirement. While the earned annuity curve has not changed the series of cost of living adjustments (COLA) has raised the SSA benefit level well above the annuity curve until the year 2004. Retirees from 2004 to the present who paid the maximum SSA tax and who could receive the earned annuity amount are actually receiving less from SSA than they would from the assumed annuity. More recent retirees are receiving considerably less. Again, this represents a tax on high earning retirees.

SSA Benefits vs Earned Annuity

Maximum SSA Benefits as of 2011 vs Earned Annuity

If instead this boomer retires at the end of 2009 at age 65 their SSA benefit would be $26,064 or $1,659 below their “earned” amount. Of course spousal benefits would raise the total accordingly well above the “earned” amount depending on the spouse’s work history. The significant point is that while SSA Welfare isn’t as substantial for boomers as it is for WWII’ers even today’s boomer retirees could receive major welfare payments (if married) in the guise of SSA benefits. Single retirees however, end up subsidizing others. So, yes it is different today but only in degree.

Millennials: How will it be tomorrow for today’s millennials? Well, the bottom line is that since 1999 high earners (if single) began receiving less in SSA benefits than they would by investing and annuitizing their own tax payments. This trend will only be exacerbated as full retirement age is increased, as income levels are raised and as the tax rate inevitably increases. The trend then is for the upper earner millennial to become more and more a subsidizer of  lower income earners. At some point in the future even the addition of spousal benefits may not shift a high earner into a welfare recipient. This can only be considered as a stealth tax on high earning millennials above the federal income tax and hidden from view by bureaucratic dictate.

What is important to take away from this exercise is that whatever the rhetoric, social security was clearly designed in the form of a massive Ponzi scheme that required an ever larger number of workers to support current retirees. When that quickly became impractical the tax rates and income levels were raised in lieu of additional workers. Indeed, were it not for those who die before receiving benefits or who die early after receiving benefits (thus cheating their families out of their tax payments) the SSA program would have long since imploded. Adding fiscal injury to monetary insult one Congress after another purchased votes by raising benefits, expanding eligibility, and adding inflation protections. Again the total cost as well as tax rates and income levels rose dramatically. From an original 1% tax on the first $3000 of wages in 1937 (over $45,000 in current dollars) the cost has risen twelve fold to a 6.2% tax on $106,800 (and rising) of wages. The worst of both worlds.

Regrettably as the 1983 Greenspan Social Security Commission did so does the Obama Deficit Commission. Both simply tweak the system and kick the SSA can down the road. There is no discussion of the inherent structural flaw of the SSA program. By continuing the dishonest assumption that SSA benefits are somehow fully “earned” workers (and non-workers) continue to expect to receive those benefits. Yet even today a high earner with a non-working spouse continues to receive unearned benefits especially as they live beyond the actuarial life span. A more honest explanation of the structural flaws in the program would provide a firm basis to propose more realistic and responsible long term solutions that might provide some financial security for individuals and their families without robbing their neighbors or their children. It’s time to trust the people with the truth.

My proposal is to vest individual SSA tax payments in an RCD investment vehicle with a minimum return and taxpayer guarantee. This provides a wealth creation mechanism for the working class and ensures that future Congresses cannot borrow and spend that money and that Wall Street will never get their hands on those funds. At the same time the employer portion can provide benefits for the non-working spouse, the disabled and those who exceed their actuarial life span as well as the minimum investment subsidy. However, some SSA programs such as disability should be transferred to general welfare.

Social Security: The 6% Solution *

March 27, 2011

* Or, How to Transform SSA into an Individual Retirement Plan

Late in 2010 President Obama’s Deficit Commission disgorged their budget recommendations. The complex and difficult work under the combined wisdom of these earnest, well regarded, leaders has resulted in a series of entitlement proposals that are significant for their disregard for physical laborers, all young people and every responsible individual. Not to have seized this opportunity to revamp a failed program is a feckless and cowardly insult to hard working, responsible individuals and is most egregious to young people. Choosing to raise the taxation level, institute means testing and bump out the full retirement age could not be a bigger insult to America’s responsible citizens. No, this is just another instance of kicking the entitlement can down the road just as did the 1983 Greenspan Commission on Social Security. It too failed to correct the long term entitlement program and so will these proposals.

Raising the taxation level will, under the current SSA benefit scheme merely result in larger benefits to the upper income retirees down the road. It only temporarily solves the current benefit issue and does so by creating a worse predicament in future years. Means testing seems viable but it ignores the current SSA rules that link tax payments to benefits. Further, to change the program after the fact, when upper income individuals have already paid in their full tax payments only to find their benefits arbitrarily reduced upon retirement is dishonest at best. It will achieve full disrepute not by means testing directly but by instead instituting an increased tax rate on upper income SSA benefits. The left hand will take what the right hand gives. And the always favorite scheme of bureaucratic desk warmers to bump out the retirement age, is so rife with discriminatory application one wonders how it can pass the ADA (American’s with Disability Act). Anyone who physically labors will pay a steep price in lost benefits and lost jobs as they approach their later years. Who will hire a 60 year old laborer?

I propose a “6% Solution” to the current Social Security Ponzi scheme. My proposal gives individuals control over their retirement funds and retirement age. It also provides a wealth creation scheme that protects their families in the event of early death or disability. It specifically avoids giving monies to Wall Street or to the government. It utilizes existing government guarantees to protect the individual accounts along with a new scheme to provide a minimum return on their retirement funds. At the same time it provides a secondary revenue stream to government to provide funds for current retirees, those who are disabled and to provide for the minimum return on the retirement accounts. That secondary revenue stream is simply the employer’s portion of the current social security tax.

My proposal will result in the “Individualization of Social Security”. This is not privatization with its Wall Street connotations. Individualization uses the existing banking system with its FDIC guarantees and is premised on typical bank Certificates of Deposit. In essence an individual’s monthly social security tax payments would be deposited in a Retirement Certificate of Deposit (RCD) in a bank of their choosing. This RCD would, to the bank, be the same as any other CD. The bank would use those funds to make loans to individuals and businesses. The RCD would receive the current FDIC protection ($250,000 at present). However, the RCD may not be cashed or used as collateral. It is strictly intended to provide retirement benefits.

The new minimum return scheme is to ensure that every individual is able to earn a minimum 6% return on their RCD. This is necessary because of the Federal Reserve’s repeated and ongoing action to maintain interest rates at levels that provide little or no interest income. The basic idea is that the bank will pay the RCD interest at the higher of 6% or the current 10 year treasury note rate. The government will guarantee the bank the difference between 6% and the current 10 year treasury note. This difference is currently about 3.35% owing to the Federal Reserve’s monetary policies. The money to provide this subsidy is obtained from the secondary revenue stream. Of course if the Federal Reserve would raise interest rates to more normal levels the subsidy would all but disappear.

There would need to be a transition of course for those who have been in the workforce for some time but who are still distant from retirement age. Such a transition could be accomplished by a transfer of the existing Treasury notes or notes in the social security trust fund to each individual according to their own individual work history. Each bank can redeem those treasury notes/notes for capital from the Federal Reserve. In this way the individual retirement CD accounts, the RCD’s, can be funded.

This not a perfect scheme and likely has serious flaws. However, it is an attempt to put each working individual in charge of their retirement. At the same time it removes government from direct responsibility while leaving government (e.g., taxpayers) liable to protect and guarantee the retirement accounts. By limiting the accounts to an RCD as opposed to stocks or bonds the taxpayer guarantee is likely to have limited exposure. There are three principal benefits to this scheme.

  1. charge each individual worker with responsibility for their own retirement by giving them direct ownership of their retirement account.
  2. remove the workers retirement funds from government control thus eliminating the resulting spending of those funds by the government and limiting government control over individuals retirement choices.
  3. ensure workers retirement funds are isolated from Wall Street and in exchange provide guaranteed minimum returns and security of the accounts.

When Experts Disagree –

March 21, 2011

For some time now I have been pondering the conumdrum of what to do When Experts Disagree. Naturally the next line would have to be, ” And, When Don’t They?”

My interests (as with many people) lie in the political, economic, financial and investment worlds but like most folks I dip into other worlds such as medicine, environment, education and social policy as I meander down life’s paths. And as I peek into those side worlds and stare at my intrinsic worlds I am confident that this issue of When Experts Disagree flows into nearly (if not every) facet of our modern life. The great question is what, exactly, do we – the decided non-experts do when those experts upon whom we supposedly depend disagree?

As an example,Professor Don Boudreaux wrote a letter to the Wall Street Journal, noting one such disagreement among economics experts:

Justin Lahart accurately reports that, as recently as last year, the late Paul Samuelson dismissed F.A. Hayek’s book The Road to Serfdom as alarmist and wrong: “Sweden and its Scandinavian neighbors are among the most socialistic countries in the world, as Mr. Hayek defined them, Mr. Samuelson pointed out.  ‘Where are their horror camps?’ he [Samuelson] wrote” (“The Glenn Beck Effect: Hayek Has a Hit,” June 17).

Indeed, do physicists even agree on the speed of light? The short answer is, at best, maybe, maybe not. From another area, Curious About Astronomy, comes another type of disagreement among experts.

However, other astronomers disagree that the experiment is able to measure the speed of gravity, arguing that the effect is much smaller than the scientists claim and that (in effect) they got their arithmatic wrong when they decided that the speed of gravity did come into the equations. They are not claiming that the speed of gravity is different to that of light, just that it could not be measured in the experiment.

Clearly this disagreement is at an intellectual level far beyond my capability. But, then, I’m not an expert in anything so almost every disagreement by experts is beyond my intellectual capability. The question though remains: what do I (we), as  non-experts do when experts disagree – as they almost always do?

Take another set of disagreements at the stratospheric intellectual level. This is the abstract for a translation of a disagreement between Albert Einstein and Walter Ritz.

During 1908 and 1909 Ritz and Einstein battled over what we now call the time arrows of electrodynamics and entropy. Ritz argued that electrodynamic irreversibility was one of the roots of the second law of thermodynamics, while Einstein defended Maxwell-Lorentz electromagnetic time symmetry. Microscopic reversibility remains a cornerstone of our current paradigm, yet we are finding more and more evidence that experimentally discerned time arrows are asymmetrical and that they all point from past to future. This paper furnishes some comments about events leading up to the Ritz-Einstein confrontation, some subsequent developments, and an English translation of their agreement to disagree. A side by side comparison of two recent summaries of their battle communiques is included to provide an overview of what they had to say about this current issue.

In matters of scientific fact we may – and most assuredly I emphasize MAY – allow scientists to conduct their experiments to discover the facts of a situation. But what happens when the science community cannot experiment but can only create models they think mirror reality? This is precisely the circumstance in the arguments regarding global warming. Or, more specifically, anthropogenic global warming (AGW), warming caused exclusively by the acts of man. The facts cannot be determined by experiment. The various scientific camps create computer models and argue about the models and the input data and it all has taken on the slimy sheen of a political argument, not a scientific one.

What would we do if our lives were dependent on deciding which of these experts, these intellectual giants was correct? Or even which was more correct? How would we decide? What would be the basis of our decision? Ultimately, might one even be so arrogant as to ask why even consult the experts? For if they ultimately disagree and we are not expert yet we must make a decision then why consult them at all? How would we, on what basis would we, differentiate between the various expert camps?

What do we do when our experts disagree?

Bond Portfolio Frustrations

March 21, 2011

Below is an excerpt from a Morningstar article by Christine Benz published on 2/28/2011

 The Error-Proof Portfolio: Nervous Bond Investors–Don’t Make These Mistakes

“The second potential risk for individual-bond investors right now is one of lost opportunity more than anything else: If available bond yields pop up from today’s ultralow rates, buy-and-hold individual-bond investors won’t be able to take advantage of them until their securities mature. And when they do, they’ll be forced to reinvest their bonds at whatever interest rates may be on offer, even though interest rates could go even higher in the future.”

This attitude is so frustrating. I’ve seen it from Morningstar and individual investment advisors alike. In a discussion of bond allocation in a portfolio to infer that individuals should remain in cash or only buy a capital losing bond mutual fund because otherwise we’ll miss other investment opportunities is downright insulting. What the heck are the alternatives? Bond funds? The implication is that individuals should only invest in bond mutual funds so that we don’t miss investment opportunities! Phooey.

If I invest in a bond mutual fund I will lose a lot more than opportunity compared to buying individual bonds. I will lose capital and with it the opportunity to invest in anything. So what if I have to re-invest my matured bonds at “… whatever interest rates may be on offer, …”. Doesn’t that give me the chance to re-invest at much higher yields? And this is as compared to a bond mutual fund throwing my capital away in order to maintain a fixed duration in their fund. And rarely does the resulting yield rise recoup my capital loss. This comment poisons the rest of the article.

Insider Trading Hooey

October 25, 2009

The Saturday, October 24, 2009 issue of the Wall Street Journal’s “Weekend Journal” had a front page article, “Learning to Love Insider Trading” by one of my favorite bloggers. The author is Professor Donald J. Boudreaux, Professor of Economics at George Mason University. His blog, “Café Hayek” is on my daily reading list. More often than not I find agreement with his points of view. Not so with this article. In fact, were I the professor and this a student paper it would get no more than a “D” and even that only for penmanship.

 In support of insider trading Prof. Don provides two examples. The first is the governmentally imposed gasoline price fixing and limitations on purchases. How this relates to insider trading is a mystery. Prof. Don writes that it shows the failure of price discovery as it relates to supply and demand. Of course it does. That was the explicit purpose. Governmentally imposed price and supply controls are political in nature not economic. They are imposed for political reasons; they are designed for political benefit and they are wholly divorced from economic purpose. This example fails the test of relevance.

 The second example Prof. Don provides involves “unscrupulous management” that drives a company to the brink of bankruptcy but hides the financial facts from both the public and creditors alike. In this example Prof. Don uses actual, literal, criminal fraud to justify insider trading. This is even more mystifying than the price controls example. Knowingly using false information to obtain credit is criminal fraud. Hiding the actual financial condition of a publicly traded company from the shareholder owners also constitutes criminal fraud – at least in my mind it does. There simply is no link between these two non sequiturs and insider trading.

 The only other justification the professor provides are quotes from two other economists, Henry Manne and Jeffrey Miron.  The quote from Henry Manne is instructive in that Prof. Don explains it as saying, “… when insiders trade on their nonpublic, nonproprietary information …” which is interesting in itself on several counts. First, “insiders trade on their …” except that it isn’t “their” information it is the owners information. The insiders have no right to sell what isn’t theirs in the first place. Second, “nonpublic” is quite absurd since the whole issue is about nonpublic information. If the public knew the information there would be no insider trading taking place. Third “nonproprietary” information is the key to the whole issue. What possible information could be of value that isn’t proprietary? Near the end of the article the professor addresses, or feigns an attempt to address this issue but his examination is, to be polite, weak. By definition, if it is of value it must be proprietary.

Prof. Don’s quote from Jeffrey Miron, “In a world with no ban, small investors might fear to trade individual stocks and would face a greater incentive to diversify; that is also a good thing.” Right, illegally trading on stolen information that effectively robs small investors of prospective gains thereby forcing them to diversify is a good thing. Sigh. Apparently only insiders and large, presumably professional, traders have the right to profit from stolen information. Small traders should buy their mutual funds and shut up.

Trying to exculpate insider trading for its supposed beneficial economic effects is so wrong it’s bordering on the absurd. Seriously this is a “broken window” type of economic theory. It’s analogous to saying that having your car stolen is economically beneficial since you have to replace your car and that creates economic activity.

Trying to exculpate insider trading because of insider non-trading is equally absurd. Professor, insider buying and selling or not buying and not selling is public (or should be) information. You can read about it all the time. There are a number of web sites that provide such information such as, http://www.insidercow.com/ . MSN’s site gives small and large traders access to insider buy/sell information at  http://moneycentral.msn.com/investor/invsub/insider/trans.asp . An investor can just type the ticker symbol for the data. When corporate insiders don’t sell shares – for whatever reason – this information is publicly available simply because they don’t sell! Claiming such non-activity as a prosecutorial bias and thereby justifying the insider trading is more non sequitur masquerading as reasoned thought.

In the end there is one issue that Prof. Don ignores that I find most troubling. I am a small business owner, the majority partner actually. Everything my partner and I provide in our business belongs to us. If an employee uses my computer for their personal email they do so at my convenience. As a courtesy I would periodically ask them to remove any personal items so that business functions can proceed uninhibited but it is my computer and I can do with it as I wish. We do not allow them to use our company vehicles for any personal reasons. They can’t use our tools or offices for private functions. Nor can they use our financial data or business plans for their own personal gain. In short what Professor Boudreaux ignores are the ownership rights of the shareholders. None of the insiders has unequivocal ownership rights to the information they are selling. At best they share ownership unless it is a private company and they are the sole owners. But in that case there is no public trading taking place. At bottom all insider trading robs information from the rightful owners for the personal gain of the employee insider.

Professor Boudreaux’s failure to protect the ownership rights of shareholders is a significant and substantive failure on the part of one who otherwise champions individual rights and freedoms.

Sales Gains at HD and LOW

May 19, 2009

Lowes (LOW) came out with good  less bad earnings recently and their stock rallied sharply. Home Depot (HD) came out with less bad good earnings and their stock didn’t rally. Given the cliff dive of home builders, housing starts, remodeling/renovation and the like how is it that HD and LOW have done as well (or not as bad) as they have?

As a street level economist I have long followed national economic statistics. Over the past 40 years or so I have noted with some amusement that the self-described independent economic decisions my wife and I have made seem to show up in the national economic stats a few months later. Hmmm. Maybe we’re not so independent after all? Maybe we just make our economic decisions using information similar to that of a slew of other baby boomers.

This year, owing to a change in our personal circumstance as well as the economic situation, we decided to stop using a lawn service. Instead, since I was home more (the last 4 years I’d been working away from home, returning only on weekends) I could take care of the lawn myself. Of course, I’d have to buy a lawn mower, edger, trimmer and blower to do the work. By now some of you have already figured out where I’m going.

The act of buying all that lawn care equipment certainly boosted Toro and Echo (the equipment makers). It also boosted the sales at Coastline Lawn (the retail store where I bought the equipment) and Home Depot/Lowes where I bought some miscellaneous items (gas cans, fuel stabilizer, hand tools, etc.) I expect my purchases to show up as sales in these and other companies quarterly reports. But it’s not all gain.

 No, the pain is felt by Hardy’s Grassworks, the lawn service company. A small business, they will lose the revenue I used to provide. Hardy’s grassworks is a well run business by the way – I recommend them to the Wilmington, NC area. But the bottom line is that the $1500 annual cost for Hardy’s (worth every nickel) is greater than the $1000 or so I paid for all my equipment. Since my time no longer has the same value I chose to buy the euipment, cancel the service and do the work myself. The net result to the national economy is a gain of +$1000 for the equipment purchases (an immediate gain) but an annualized loss of -$1500 to be felt over the next 6-9 months.

Multiple my choice out by 5 or 10 million like minded 60+ boomers and the national result is an annualized drop in GDP of perhaps $5 Billion or more. Not much in a $14 Trillion economy but a billion here, a billion there and pretty soon we’re talking real money (to misquote an old congressman). And keep in mind that my particular series of choices shows up real quick in the sales figures but real slow in the small business revenues (and ultimately the taxes they pay).

Maybe, just maybe those HD and LOW sales and earnings gains improvements not so bads are temporary?

Gold vs CPI

March 19, 2009

Gold as a store of value  

I appreciate all the comments on my article. Even those who call me an “idiot” will not be surprised to learn that my wife agrees with them at least once a week. In an effort to diminish that view I have done a bit more research to compare gold with the CPI (consumer price index) as published by the Bureau of Labor Statistics. The CPI is available from 1913 to the present. I selected, again, the annual values to compare with the annual spot price of gold. Several comments suggested gold is an insurance policy against inflation I presume.  Others suggested gold is a “store of value” (SOV) not an investment, again I presume against the loss of value due to inflation. At least one excoriated me for ignoring the fact that ownership of gold was prohibited until 1974.


The comment about gold ownership being prohibited until 1974 ignored the main thrust of the article. Gold completely failed as an investment over the twenty year period from 1980 through 2000. Yet gold was freely traded during this time. I examined the longest possible historical record to obtain as much information as possible about the relative value of gold versus the DJIA. Yes, gold was prohibited until 1974. But ownership of stocks was relegated to a small minority of the population as well. Neither fact changes the conclusion of the article that whether gold outperforms the DJIA depends on the current economic circumstances. Neither is “best” at all times.


As insurance against inflation I believe gold also fails since insurance is designed to replace value dollar for dollar. If 10% of a portfolio is in gold then a doubling of the value of gold is required to increase the portfolio by 10%. Stated differently, to protect against a 10% inflation rate requires that gold (at 10% of the portfolio) double in price. Gold certainly can double in a year (or less) but it has never done so over any extended period of time and never done so during periods of low to moderate inflation. Gold only jumps in value during periods of extreme financial stress. Of course, today we are in fact experiencing extreme financial stress so gold is doing well. For now.


As a store of value (SOV) gold, or any asset for that matter, must also perform well as an investment. I am clearly not the brightest bulb in the chandelier but I cannot understand how a poorly performing investment can succeed as a store of value. But set that argument aside. Given a historical record of the CPI how does gold stack up as a store of value? The BLS statistics set 1982-1984 as 100 and then adjust the CPI up or down accordingly. Thus if inflation at some future time is double what it was in 1982-1984 the CPI goes to 200. If it were half the CPI drops to 50.


Since the 1983 CPI is set at 99.6 I arbitrarily used that as my base level for inflation. Also, since gold had been trading freely at that time I set the yearend spot price of gold, 415.00 as my base level for the price of gold. Using the base level of gold I then adjusted the price using the annual CPI figures for each year. By coincidence the CPI adjusted price of gold in 1974 was 203.78 versus the actual spot price of 195.20 which is extremely close.


There were several interesting results from this exercise. First, the CPI adjusted price of gold was well above the government set levels from 1913 through 1973, sometimes by 2 or 3 times. This suggests the government was arbitrarily devaluing the dollar, in gold terms during this period. No big surprise there. What was a surprise is that from 1974 through 1978 spot gold was still below the CPI adjusted level. However, even more stunning is that the only times spot gold exceeded the CPI adjusted level was from 1979-1983 plus 1987 and 2008. If we only look at the period from 1974 through 2008, when gold was freely traded its SOV function was only reliable for a single 5 year period plus two additional separate years of extreme financial stress. Obviously 2009 and beyond may add to gold’s SOV utility.


My conclusion is that gold as a store of value, as a hedge against inflation and as an investment is only valuable during periods of extreme financial stress. We are in such a period at the present. Gold is doing well, at the present. Stay alert for improvements in the underlying economic circumstances and protect yourself. The gold versus CPI table is available below.

CPI Adjusted Price of Gold

March 19, 2009
Finfacts Ireland Consumer Price Index
Historical Gold Prices U.S. Department Of Labor
Source: Bureau of Labor Statistics
Global Financial Data 1982-84=100
CPI Adj.
GOLD CPI Price of
Year  Close Annual Gold
1913 20.67 9.9 40.92
1914 20.67 10.0 41.33
1915 20.67 10.1 41.75
1916 20.67 10.9 45.05
1917 20.67 12.8 52.91
1918 20.67 15.1 62.41
1919 20.67 17.3 71.51
1920 20.67 20.0 82.67
1921 20.67 17.9 73.99
1922 20.67 16.8 69.44
1923 20.67 17.1 70.68
1924 20.67 17.1 70.68
1925 20.67 17.5 72.33
1926 20.67 17.7 73.16
1927 20.67 17.4 71.92
1928 20.67 17.1 70.68
1929 20.67 17.1 70.68
1930 20.67 16.7 69.03
1931 20.67 15.2 62.83
1932 20.67 13.7 56.63
1933 32.32 13.0 53.73
1934 35.00 13.4 55.39
1935 35.00 13.7 56.63
1936 35.00 13.9 57.45
1937 35.00 14.4 59.52
1938 35.00 14.1 58.28
1939 35.00 13.9 57.45
1940 34.50 14.0 57.87
1941 35.50 14.7 60.76
1942 35.50 16.3 67.37
1943 36.50 17.3 71.51
1944 36.25 17.6 72.75
1945 37.25 18.0 74.40
1946 38.25 19.5 80.60
1947 43.00 22.3 92.17
1948 42.00 24.1 99.61
1949 40.50 23.8 98.37
1950 40.25 24.1 99.61
1951 40.00 26.0 107.47
1952 38.70 26.5 109.54
1953 35.50 26.7 110.36
1954 35.25 26.9 111.19
1955 35.15 26.8 110.78
1956 35.20 27.2 112.43
1957 35.25 28.1 116.15
1958 35.25 28.9 119.46
1959 35.25 29.1 120.28
1960 36.50 29.6 122.35
1961 35.50 29.9 123.59
1962 35.35 30.2 124.83
1963 35.25 30.6 126.48
1964 35.35 31.0 128.14
1965 35.50 31.5 130.20
1966 35.40 32.4 133.92
1967 35.50 33.4 138.06
1968 43.50 34.8 143.84
1969 35.40 36.7 151.70
1970 37.60 38.8 160.38
1971 43.80 40.5 167.40
1972 65.20 41.8 172.78
1973 114.50 44.4 183.52
1974 195.20 49.3 203.78 Gold Ownership Permitted
1975 150.80 53.8 222.38
1976 145.10 56.9 235.19
1977 179.20 60.6 250.48
1978 244.90 65.2 269.50
1979 578.70 72.6 300.08
1980 641.20 82.4 340.59
1981 430.80 90.9 375.73
1982 484.50 96.5 398.87
1983 415.00 99.6 413.34 Base Value
1984 331.30 103.9 429.46
1985 354.20 107.6 444.75
1986 435.20 109.6 453.02
1987 522.9 113.6 469.55
1988 441.00 118.3 488.98
1989 433.40 124.0 512.54
1990 423.80 130.7 540.24
1991 379.90 136.2 562.97
1992 356.30 140.3 579.92
1993 419.20 144.5 597.28
1994 409.80 148.2 612.57
1995 385.60 152.4 629.93
1996 367.80 156.9 648.53
1997 288.80 160.5 663.41
1998 288.00 163.0 673.74
1999 287.50 166.6 688.62
2000 272.15 172.2 711.77
2001 278.70 177.1 732.03
2002 346.70 179.9 743.60
2003 414.80 184.0 760.55
2004 438.10 188.9 780.80
2005 517.20 195.3 807.25
2006 636.30 201.6 833.29
2007 833.20 207.3 857.03
2008 926.72 215.303 889.93  

DJIA vs. Gold

March 15, 2009

Gold as a store of value

I’m not a gold bug. I believe gold’s use as an investment and store of value is a historical artifact not well suited to the modern era. When sailing ships ruled the seas it may have been a fine store of value but when spaceships rule the skies it feels, well, a bit leaden. But, still, in the current environment the question needs to be asked: “does gold still have investment value or has it become the fool’s emporium?”


It is exceedingly tedious to sift through the competing and often repetitive claims of gold’s investment value or lack thereof. Attempts at discussion often devolve, and rapidly so, into emotional arguments emanating from rigid positions of gold owner versus non-owner. Such arguments are hardly a useful insight into gold’s value as an investment and thus as a store of value.


The thought occurred to me that if gold was indeed the best investment vehicle and store of value then it ought to handily outperform other investment vehicles over extended periods of time. On that premise I determined to compare the long term spot price of gold versus the long term Dow Jones Industrial Average (DJIA). Such a head to head comparison might be able to determine the relative value of either investment vehicle as a long term store of value. In this process I arbitrarily assume that the better investment vehicle is therefore, the better store of value.


Of course, if gold or the DJIA does not provide a net positive return then it fails as an investment and also as a store of value. Thus we need to first determine if either vehicle provides a long term positive return. If so, then we can compare those returns to determine which vehicle is better. So, does either provide a positive return? Which is the better investment: gold or the DJIA?


It depends

As is too often the case the answers to both questions are disappointing. Do gold and the DJIA provide a positive long term return? It depends. Which is the better investment? It depends. What do these answers depend upon? They both depend upon the time period selected. Pick one time period and neither is positive. Pick another and both are positive. Pick a third time period and gold handily outperforms the DJIA. Pick a fourth time period and the DJIA buries gold. Let’s take a closer look to better understand the importance of the time period in answering these two questions.


I confess that I am not a mathematician but a small time investor and trader. My objective is to find investments that preserve my capital and provide a net, positive, real rate of return. Given an opportunity I will of course, pick the higher, risk adjusted, rate of return over the lower. Who wouldn’t? With stocks having fallen some 50% over the past year the gold bugs are out in force.  Having been inundated with the buy gold, buy gold, buy gold mantra in the news media, blogs and commentary I have decided to examine gold more closely. Being at best agnostic about gold I wanted to find out if I am wrong and the gold bugs are right or if my negative intuitive response was more appropriate.


The data

I have obtained the annual DJIA values from 1899 through 2008. I have also obtained spot gold prices over the same time period. Since I am examining both vehicles as long term investments rather than as short term trading vehicles I contend that annual prices are sufficient for my examination. To buttress that contention I note that it is exceedingly rare for any gold bug to ever recommend selling gold. And, clearly the most profitable investor of our time, Warren Buffett is a self-described buy and hold investor. Thus I believe annual data is sufficient for a long term investor.


Within the time period available, 1899 through 2008 some anomalies exist. The biggest is that up until 1933 the price of gold was fixed at $20.67. It is not a fair comparison when one investment vehicle is fixed in price while the other enjoys a measure of volatility. Most of my comparisons then are relegated within the time frame of 1933 through 2008. Even so it is interesting to note that from the bottom of the Great Depression (1932) through 1941 (the start of WWII) the DJIA more than doubled while the price of gold languished.


The importance of time

In a previous existence during the Neanderthal period of personal computer technology I spent way too much time examining various rules based trading strategies. Looking back at those efforts it slowly became apparent that the time period of the data played a much greater role in the outcome of those strategies than was initially evident. Now, at a somewhat riper age one of my first questions regarding investment returns and data is, “over what period of time?” Even more important is the second question, “why that time period?”


As an example, the annual price of gold was in a long term downtrend from 1980 through 2000. The spot price declined by over half from a high of $641 in 1980 to a low of $272 in 2000. Over this same time period the DJIA increased by 1000% from 964 in 1980 to 10787 in 2000. Any comparison of gold versus DJIA over this twenty year period is overwhelmingly in favor of the DJIA.


Let’s take another time period. From 1965 through 1981 the DJIA languished from a high of 969 in 1965 down to 875 in 1981 before embarking on a twenty year bull market. Gold also languished from 1965 to 1971 but starting in 1971 gold rallied from 35 to over 430, a 1200% gain. This time the results are overwhelmingly in favor of gold. But does this tell us, as long term investors, which is the better investment?


It still depends

Table 1 below depicts the simple percentage change, or rate of return on a long term investment in the DJIA and gold. The returns are based upon the change in value over a selected period of time. The change in the DJIA value from 1899 through 2008 is 13252% while the change in spot gold over the same period is only 4383%. Since spot gold was fixed from 1899 through 1932 I next looked at the period 1933 through 2008. During that time the DJIA change in value was 8795% while spot gold only gained 2767%. The next data line looked at the post WWII period to the present (1946-2008). The results were similar if not so dramatic.

                                    Table 1

Dow Jones Industrial Average vs. Historical Spot Gold

Percent change in value over indicated time period

DJIA

13252%

1899-2008

4383%

Gold

DJIA

8795%

1933-2008

2767%

Gold

DJIA

4853%

1946-2008

2323%

Gold

DJIA

3628%

1950-2008

2202%

Gold

DJIA

1325%

1960-2008

2439%

Gold

DJIA

1481%

1970-2007

2116%

Gold

DJIA

946%

1970-2008

2365%

Gold

DJIA

810%

1980-2008

45%

Gold

DJIA

233%

1990-2008

119%

Gold

DJIA

-19%

2000-2008

241%

Gold

DJIA

23%

2000-2007

206%

Gold


The remainder of Table 1 depicts the start of a series of time periods to the present, with two exceptions. Given the dramatic selloff in the DJIA and the dramatic rise in spot gold over 2008 I also took a quick look at some results as if the data ended in 2007. These are the periods from 1970 through 2007 and the current decade, 2000-2007. Excluding 2008 data does not alter the direction of the overall results just the magnitude. These are simple calculations, value at start of period (technically end of prior year) versus value at end of period expressed as a percentage of starting value.


What this table depicts is that neither the DJIA nor gold is “THE” single best investment over all time periods and economic conditions. It clearly shows that the time period, which is to say the economic circumstances of a time period, is the determining factor as to which is the better investment.


Value of $1000

I next looked at the data in a slightly different manner, value of $1000 over a selected time period. By only examining data points at the start and end of a time period the ebb and flow of an investment is masked. While the volatility of an investment is important for long term investors, my objective was to examine the value of $1000 during the selected time period in hopes that would provide additional useful information towards determining which asset is the better investment. Table 2 below shows the value of $1000 at the end of a series of selected time periods.


The results shown in Table 2 were calculated by assuming an initial $1000 investment in each asset using the prior yearend value. That is, for the time period of 1933-2008 the yearend value of 1932 is used to initiate the investment. For the period 1970-2008 the yearned value of 1969 was used as the basis. The investment value was then adjusted up or down depending on the percentage change in each of the asset values as of yearend. The percent change was simply calculated as (last value – first value)/first value expressed as a percent. Table 2 shows the end results of this ebb and flow over various time periods.

Table 2

Dow Jones Industrial Average vs. Historical Spot Gold

Growth of $1000 over indicated time period

DJIA

$145,642

1933-2008

$44,834

Gold

DJIA

$10,966

1970-2008

$26,179

Gold

DJIA

$10,464

1980-2008

$1,601

Gold

DJIA

$3,188

1990-2008

$2,138

Gold

DJIA

$763

2000-2008

$3,223

Gold


Table 2 vividly shows the impact of the different time periods. From 1970 to 2008 gold handily outperforms the DJIA yet starting ten years later, 1980 to 2008 reverses that outcome by a dramatic margin. What happened to change the outcome so dramatically? The obvious answer is that during the mid 1970’s through the early 1980’s the economy was in a serious slump while inflation was raging to historical levels. Stocks were in the cellar while gold was going through the roof. But by the early 1980’s that circumstance had turned. The economy recovered, inflation was abating and gold was declining.


A similar circumstance appears today. Although inflation has yet to rage the economy is in a serious slump (clearly a recession, perhaps a depression) and the price of gold has once again risen to historical levels. Gold bugs are ubiquitous and the economic panic and fear is feeding the frenzy. But does that make gold a better long term investment than equities?


Charts

Chart 1 (shown below) depicts the annual change in value of a $1000 investment in both the DJIA and spot gold from 1933 through 2008. As the chart depicts the DJIA appears to exceed gold as an investment in all periods except during extreme financial stress. This is evidenced by the value of the gold investment reaching and exceeding that of the DJIA beginning in the mid 1970’s and persisting until the early 1980’s. This period was the worst post WWII recession until the present time. A similar pattern exists during the period from 2000 through 2008 as shown in Chart 2 (shown below). The DJIA shows great volatility with the end result being a severe downturn through the present time.

 The economic circumstance that is missing however may be the proverbial 800# bear in the room. So far, inflation is not raging and there are serious people who believe deflation is the more likely event. Is it possible that the gold bugs have acted quite rationally – but too early – to defend against the government’s monetary and fiscal response to the economic turmoil?

Chart 1
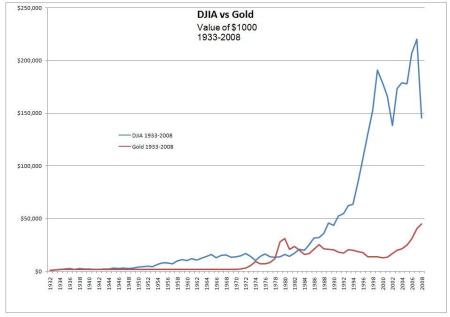
 

DJIA vs Gold Value of $1000 1933-2008

DJIA vs Gold Value of $1000 1933-2008


Chart 2
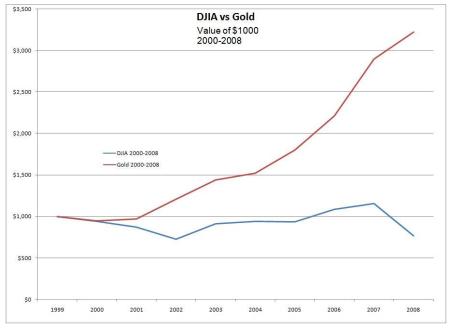
 

DJIA vs Gold Value of $1000 2000-2008

DJIA vs Gold Value of $1000 2000-2008


While gold bugs may have acted early their combined response has until recently been self fulfilling. Gold has risen from its 1980’s doldrums (after having reached a nadir in 2000) to record highs as of late. What isn’t clear is whether this is a trend that will continue. Note that gold at $2000 has been bandied about much like oil at $200 a barrel was bandied about in mid 2008. Still, there is no denying that gold has seriously outperformed the DJIA over recent years and most especially this last year. But reasonable people can point to the triple economic shocks of (a) the 2000 tech stock bust; (b) the 9-11 attacks in 2001; and (c) the housing/equity bust of 2007-2008 as the reason for the sub-par DJIA. Clearly there have been rational reasons to put more trust in gold over the past eight years. But does that make it the better investment for long term investors?


Chart 3
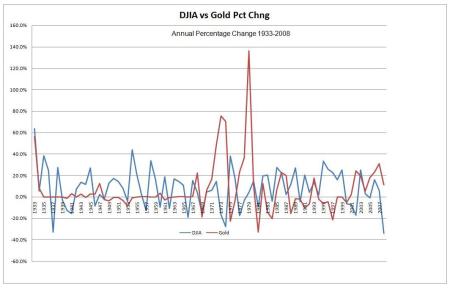
 

DJIA vs Gold Percent Change in Value 1933-2008

DJIA vs Gold Percent Change in Value 1933-2008


Percentages

Chart 3 above shows the percentage change in value, as of yearend, for gold and the DJIA over the period 1933-2008. These percents are simple calculations of yearend price minus prior yearend price divided by the prior yearend price expressed as a percentage. This chart avoids the starting point distortions evident in the Change in Value of $1000 charts. It also clearly shows the two periods when gold substantially outperformed the DJIA. Gold substantially outperformed the DJIA during the limited period of 1972-1974 and again during 1978-1981. There are other years when gold outperforms the DJIA but none as substantial or long lasting.


My Answer

I’m at best agnostic about gold. I wanted to find out if gold was in fact a better long term investment than equities as typified by the DJIA. I believe that the data has given me an answer: it depends. Whether gold or the DJIA is a better investment depends on the economic circumstances. More specifically gold appears to depend on having a substantial rate of inflation and expectations of future inflation in order to outperform the DJIA. If those expectations are absent then the DJIA outperforms. 


After gold hit its record high price in 1980 it slumped for some twenty years while the DJIA had a twenty year bull market. What happened is that inflation expectations were crushed as the government took steps to break the inflation cycle. The key factor in that case is the government correcting the economic issues of recession and stagflation thereby setting the stage for an economic recovery.


When the DJIA gets run over by its own malfeasance or by exogenous factors it too tends to slump for extended periods, circa 1965-1981, 2000-2002 and also 2008-2009. But again, when investors determine that corrective actions are underway that slump (hopefully) ends. Thus rational investors must make a determination as to whether the corrective actions of government are in fact starting to resolve the economic malaise. They must also make a valiant effort to forecast future economic circumstances and from there choose gold or equities.


Inflation or Deflation

Much of the talk today is of the extraordinary government monetary and fiscal response to the economic downturn as an inflationary factor. Even worse, this government response is a global phenomenon unlike mere national recessions of the past. Counter-balancing that are the severe credit restrictions coupled with a substantial downturn in global demand as a deflationary factor. How one interprets the outcome of these factors will determine whether gold or the DJIA is the chosen investment instrument.


One comment I read made a salient point. The unused factory capacity in China, India and the Far East is enormous. Indeed, domestic capacity as well is severely underutilized. Further, inflation is a monetary phenomenon that requires excess capital chasing too few goods. As well, deflation too is a monetary phenomenon but it requires excess goods chasing too little capital. But if the existing supply and potential supply of goods is substantial relative to demand (capital) then perhaps, just perhaps there will be insufficient capital to fully utilize all available supply. Hence, inflation may not be the 800# bear most of us believe it will become. Instead we may actually face a deflationary cycle for the first time in many generations.


This conundrum is explained by the velocity of money. As an aside capital in this case includes the money supply and the velocity of money or how fast a given dollar gets used. Velocity is currently restrained for a variety of reasons and those reasons may not recede quickly or ever. Baby boomers tend to sway the economy out of proportion to their numbers. If boomers (like me) have permanently changed their consumption habits then it is unlikely that monetary velocity will quickly resume at prior levels. Or, at the least it will not resume anytime soon.


Bottom Line

If your estimation is that future inflation is the most likely prospect then buy gold (IAU, GLD). If your estimation is for deflation then bonds (BND, HYG, LQD) are the better investment. If neither prospect seems most likely then you should select equities (DIA, SPY, QQQQ) to outperform both investments. Pick your poison.